Using kspan and Jaeger to visualize Kubernetes events as spans
Category: observability
Modified: Sun, 2023-Aug-06

Introduction
Nowadays we have lots observability tools on Kubernetes. There are tools focus on metrics (Prometheus, OpenTelemetry and etc.). There are tools focus on logging (EFK, Loki and etc.). There are tools focus on tracing (Jaeger, Zipkin and etc.) There lesser known tools that worked on the events of Kubernetes.
-
Viewing events in Kubernetes by CLI
Here is an example:
        $ kubectl get events -n your-namespace

LAST SEEN   TYPE      REASON                OBJECT               MESSAGE
54m         Normal    Killing               pod/wikijs-0         Stopping container wikijs
54m         Warning   RecreatingFailedPod   statefulset/wikijs   StatefulSet sec01/wikijs is recreating failed Pod wikijs-0
54m         Normal    SuccessfulDelete      statefulset/wikijs   delete Pod wikijs-0 in StatefulSet wikijs successful
54m         Normal    Scheduled             pod/wikijs-0         Successfully assigned sec01/wikijs-0 to node06
54m         Normal    SuccessfulCreate      statefulset/wikijs   create Pod wikijs-0 in StatefulSet wikijs successful
54m         Normal    Pulled                pod/wikijs-0         Container image "ghcr.io/bank-vaults/vault-env:v1.21.0" already present on machine
54m         Normal    Created               pod/wikijs-0         Created container copy-vault-env
54m         Normal    Started               pod/wikijs-0         Started container copy-vault-env
53m         Normal    Pulled                pod/wikijs-0         Container image "ghcr.io/patrickdung/wikijs-crossbuild:v2.5.299@sha256:4b21a539662a2c78a9d44ac6dc76c23abb32f06d8d75927a9c45ae4ed3a399bc" already present on machine
53m         Normal    Created               pod/wikijs-0         Created container wikijs
53m         Normal    Started               pod/wikijs-0         Started container wikijs
So, we have the events that shown the Kubernetes system tried to stop a container called 'wikijs-0'. The statefulset then try to re-create the failed pod. Then the Kubernetes system tried to pull create three containers. Then it marked finish at the end.
Using kspan and Jaeger to visualize these events as spans
The command and output in last section is just plain text. There is a product called kspan that can collect these Kubernetes events and sent to an OTEL collector. In this article, we would use Jaeger (all-in-one container, for development only) for visualization.
-
kspan
Originally, Weaveworks crated kspan but the development is stopped since 2021-Dec. Honeycomb forked it and created their own repository. The container image is locate in GitHub package registry.
For configuration, it just need to create a service account and with correct RBAC permission. Then create a deployment to listen for Kubernetes events and send updates to an OTEL collector.
-
Jaeger
Jaeger is a popular tool for visualizing tracing. In this article, the Jaeger deployment would be an all-in-one container image. It would contain OTEL collectors, Zipkin collectors, Jaeger agent and UI. It is not aimed to use for production. It is because the collected data are stored in memory and would not be persisted. To persist the collected data, it would need to be stored in the storage backend (Elastic Search 7.x, Cassandra) are officially supported. ClickHouse support is in the contrib module.
The kspan and Jaeger setup
-
kspan
Here is the setting I used for the kspan
        ---
apiVersion: v1
kind: Namespace
metadata:
  name: kspan

---
apiVersion: v1
kind: ServiceAccount
metadata:
  namespace: kspan
  name: kspan

---
apiVersion: rbac.authorization.k8s.io/v1
kind: ClusterRoleBinding
metadata:
  name: cluster-role-binding-kspan
roleRef:
  apiGroup: rbac.authorization.k8s.io
  kind: ClusterRole
  name: view
subjects:
  - kind: ServiceAccount
    name: kspan
    namespace: kspan

---
apiVersion: apps/v1
kind: Deployment
metadata:
  labels:
    app: kspan
  namespace: kspan
  name: kspan
spec:
  replicas: 1
  selector:
    matchLabels:
      app: kspan
  strategy: {}
  template:
    metadata:
      labels:
        app: kspan
    spec:
      terminationGracePeriodSeconds: 10
      serviceAccountName: kspan
      automountServiceAccountToken: true
      securityContext:
        # fsGroup:
        # runAsUser:
        runAsNonRoot: true
      containers:
        # https://github.com/honeycombio/kspan/pkgs/container/kspan%252Fkspan
        - image: ghcr.io/honeycombio/kspan/kspan:0.2.1
          name: kspan
          # command:
          #  - /manager
          args:
            ## - --enable-leader-election
            - --otlp-addr=otlp-collector-grpc.jaeger-simple.svc.cluster.local:4317
          resources:
            limits:
              cpu: 100m
              memory: 40Mi
            requests:
              cpu: 100m
              memory: 30Mi
          securityContext:
            allowPrivilegeEscalation: false
            capabilities:
              drop:
                - all
            privileged: false
            readOnlyRootFilesystem: true
            runAsNonRoot: true
            #runAsUser:
            #runAsGroup:
            seccompProfile:
              type: RuntimeDefault
For reference, there are people already written Helm chart or working config examples:
Note I had updated some settings that works for me. For example, I use the ClusterRole 'view' instead of 'cluster-admin', to avoid granting excessive privilege to the service account. I comment out some settings that does not seem to work.
-
Jaeger (all-in-one)
Here is the setting I used for the Jaeger:
        ---
apiVersion: v1
kind: Namespace
metadata:
  name: jaeger-simple

---
apiVersion: v1
kind: Service
metadata:
  labels:
    app: jaeger
  namespace: jaeger-simple
  name: otlp-collector-grpc
spec:
  selector:
    app: jaeger
  ports:
    - port: 4317
      protocol: TCP
      targetPort: 4317

---
apiVersion: v1
kind: Service
metadata:
  labels:
    app: jaeger
  namespace: jaeger-simple
  name: http-ui
spec:
  selector:
    app: jaeger
  ports:
    - port: 16686
      protocol: TCP
      targetPort: 16686

---
apiVersion: apps/v1
kind: Deployment
metadata:
  labels:
    app: jaeger
  namespace: jaeger-simple
  name: jaeger
spec:
  replicas: 1
  selector:
    matchLabels:
      app: jaeger
  strategy: {}
  template:
    metadata:
      labels:
        app: jaeger
    spec:
      terminationGracePeriodSeconds: 12
      securityContext:
        fsGroup: 10001
        runAsUser: 10001
        runAsNonRoot: true
      containers:
        # https://www.jaegertracing.io/docs/1.47/getting-started/
        - image: docker.io/jaegertracing/all-in-one:1.47
          name: jaeger
          env:
            - name: COLLECTOR_OTLP_ENABLED
              value: "true"
            - name: COLLECTOR_ZIPKIN_HOST_PORT
              value: ":9411"
          ports:
            - containerPort: 16686
              protocol: TCP
              name: http-ui
            - containerPort: 4317
              protocol: TCP
              # <= 15 char
              name: otlp-sink-grpc
            - containerPort: 4318
              protocol: TCP
              # <= 15 char
              name: otlp-sink-http
            - containerPort: 14250
              protocol: TCP
            - containerPort: 14268
              protocol: TCP
            - containerPort: 9441
              protocol: TCP
              name: zipkin-http
            - containerPort: 5775
              protocol: UDP
              # deprecated zipkin.thrift
            - containerPort: 6831
              protocol: UDP
            - containerPort: 6832
              protocol: UDP
            - containerPort: 5778
              protocol: TCP
          securityContext:
            allowPrivilegeEscalation: false
            capabilities:
              drop:
                - all
            privileged: false
            # readOnlyRootFilesystem: true
            runAsNonRoot: true
            runAsUser: 10001
            runAsGroup: 10001
            seccompProfile:
              type: RuntimeDefault
I created kspan and Jaeger in two different namespaces. Next, I did not include the Ingress setting in here. By default, there are no authentication to the Jaeger UI. You may want to add HTTP basic authentication to it. For example, use of Traefik middleware can achieve this.
Visualizing Kubernetes events in Jaeger
Let’s see some screenshots inside Jaeger.
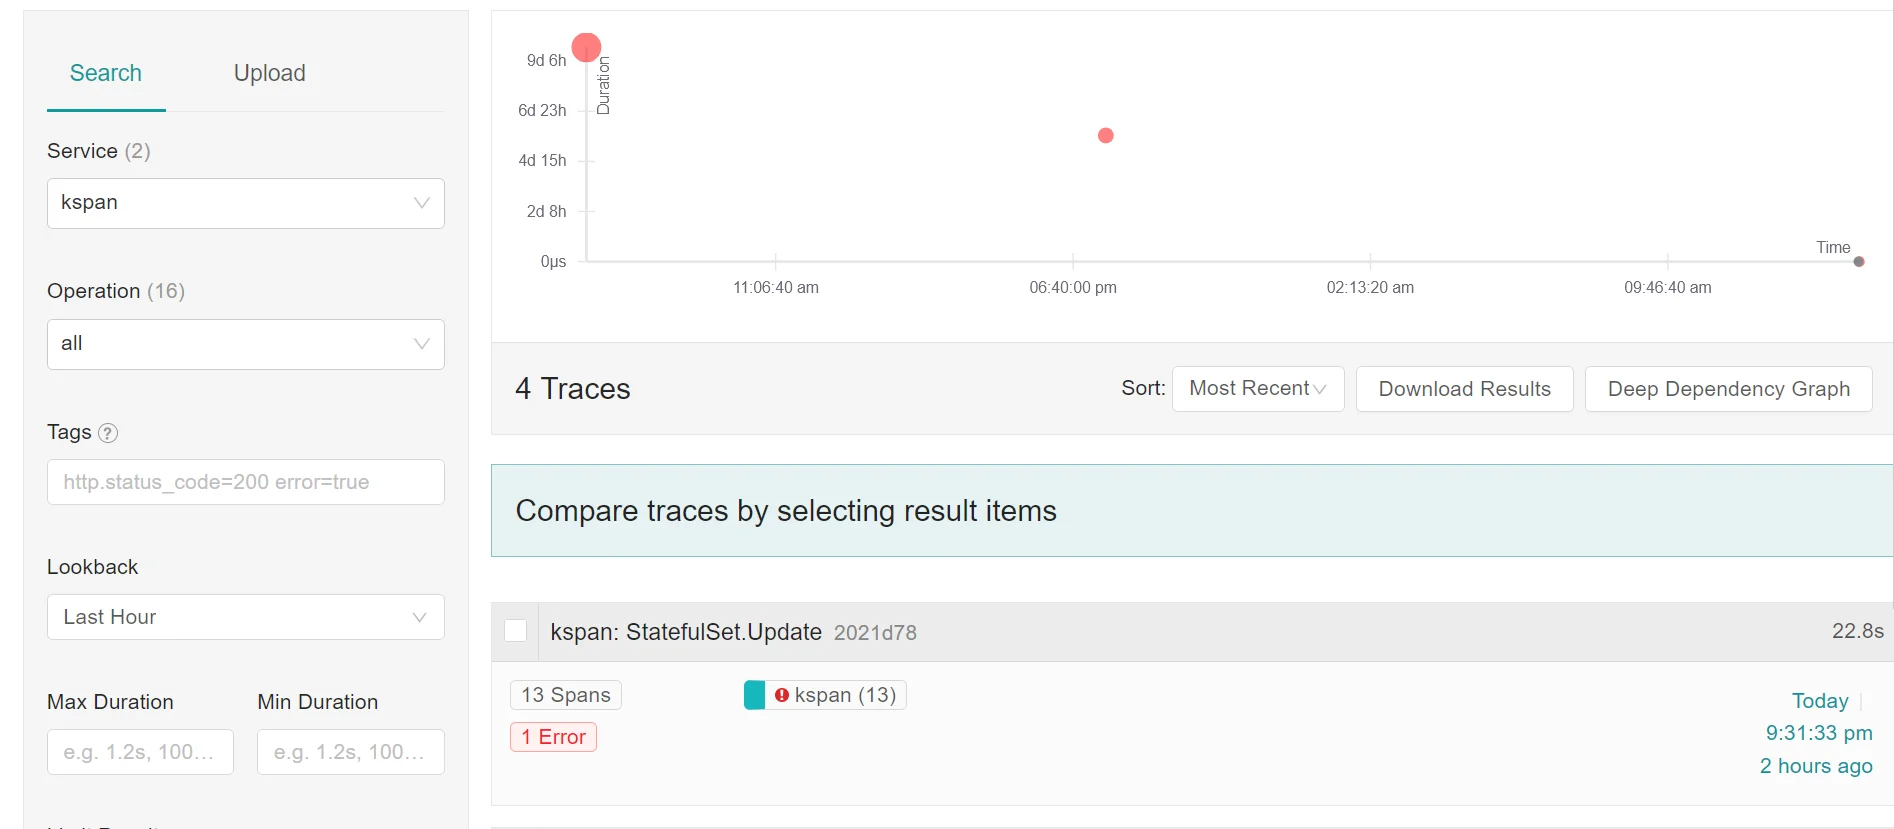
Firstly, in the Jaeger UI, choose 'kspan' in the Service (left-hand side of the sidebar). It shows four traces. The first item has 13 spans. It is related to the restart of the pod in the statefulset earlier of this article. There is timestamp displayed on the right of the spans.

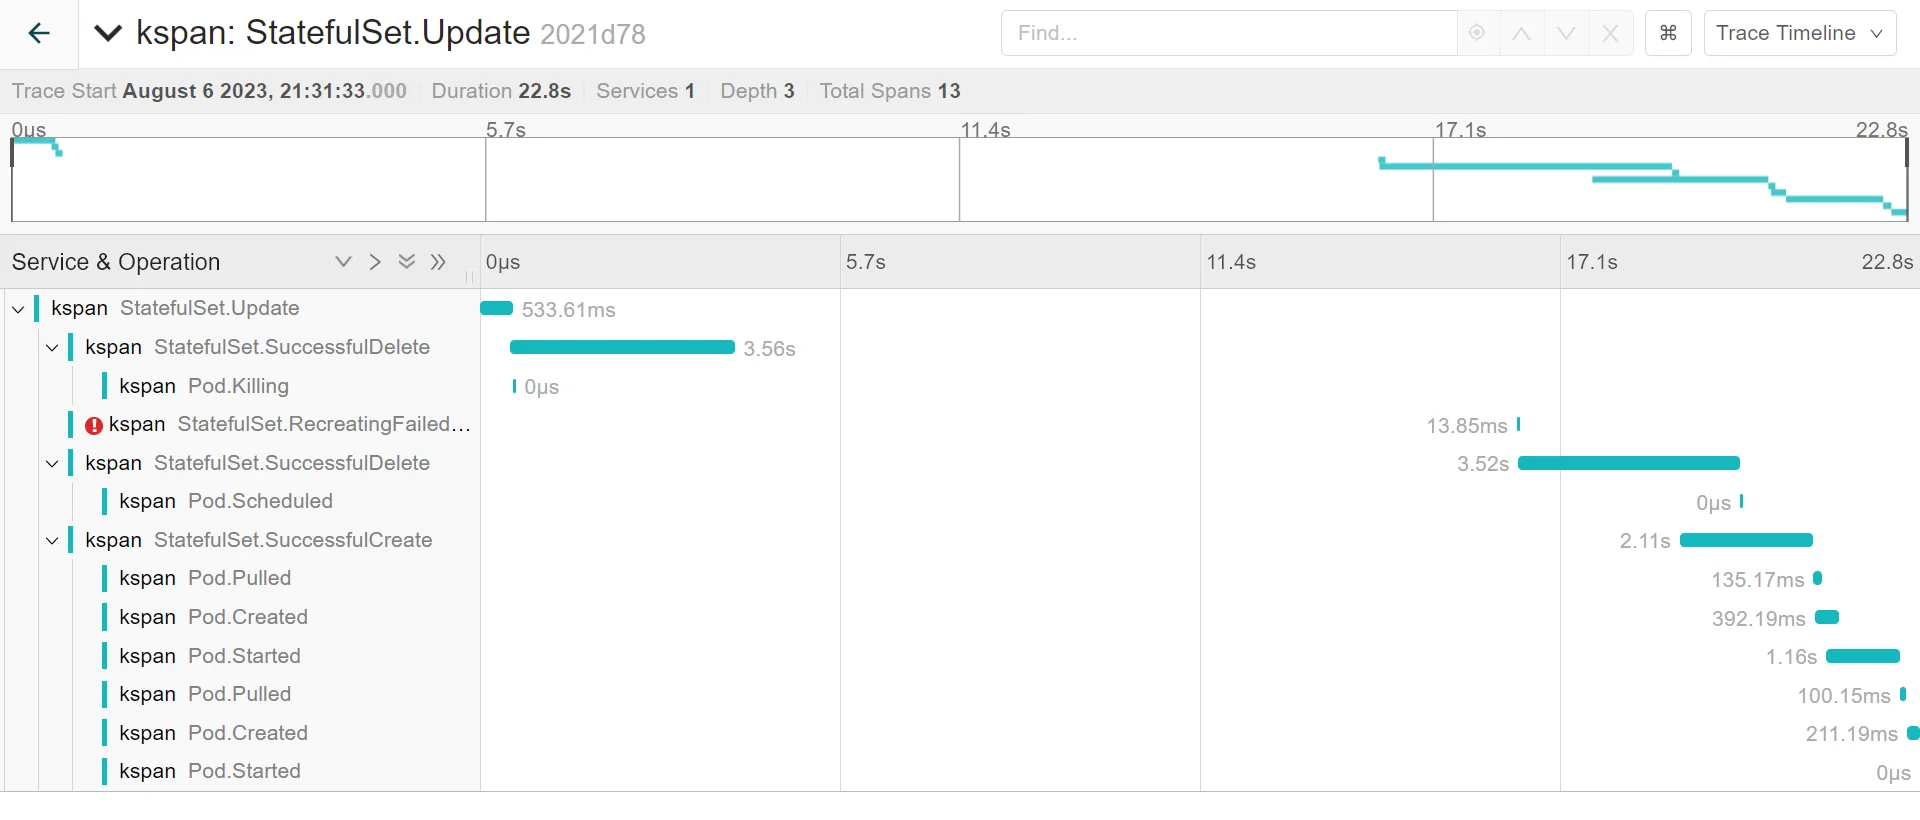
Let’s click the item to see what is inside. The sequence of operations is displayed.

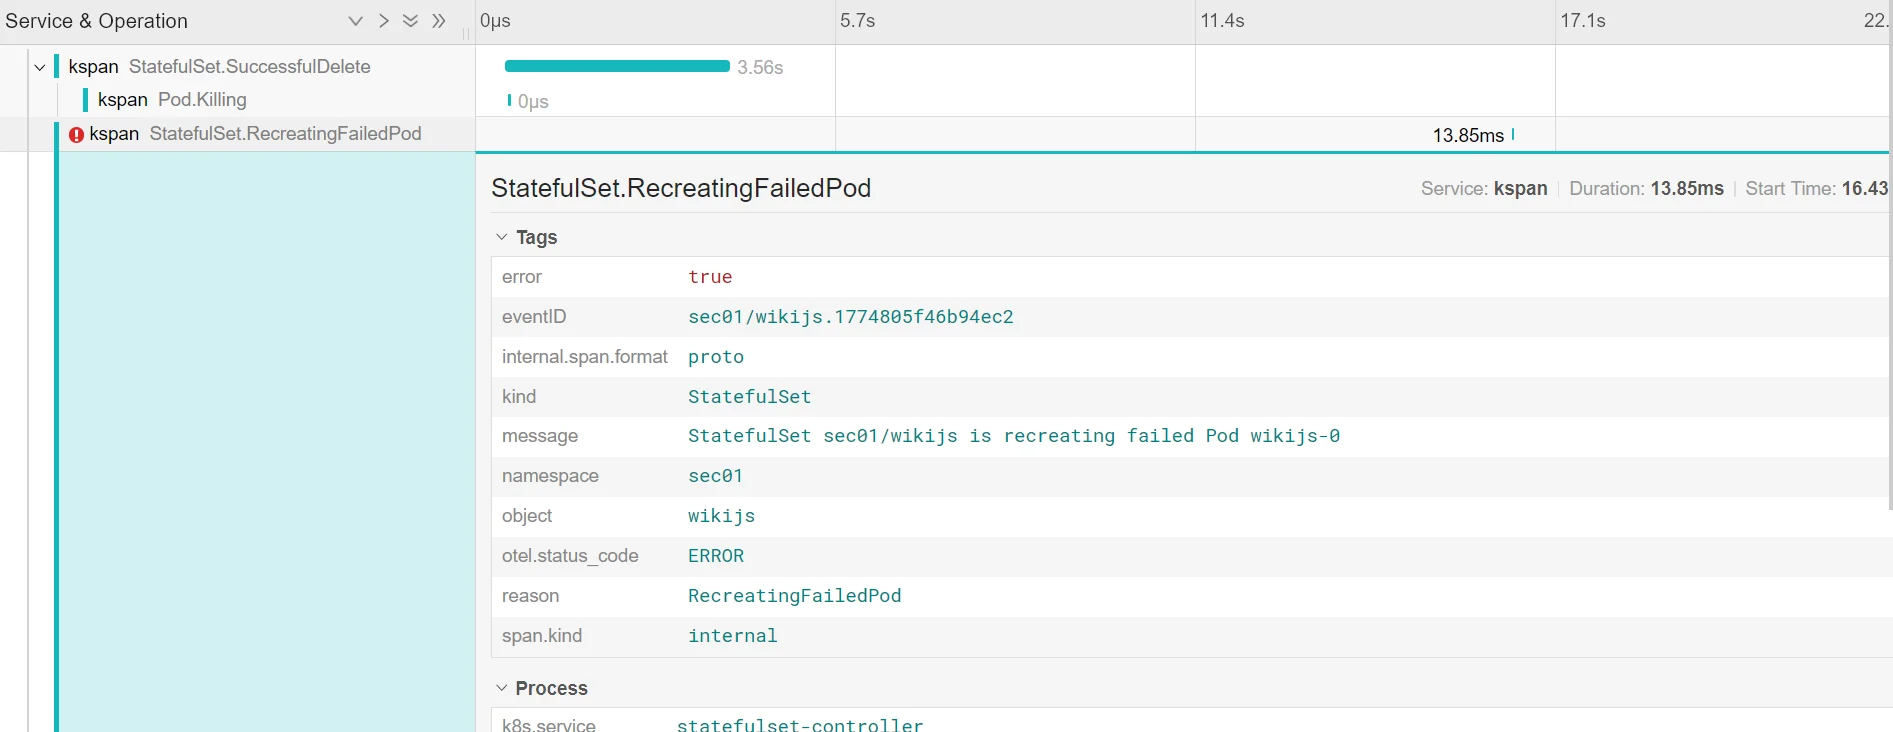
We can click the item with the exclamation mark to see the details. So, it is re-creating a failed pod. The problem namespace is sec01, the problem statefulset is called wikijs.

References
-
Honeycomb kspan repository

Comments
No. of comments: 0
Please read and agree the privacy policy before using the comment system.