Migrating logs stored in OpenSearch to ClickHouse and enable OTel support
Category: observability
Modified: Sat, 2026-May-02

Introduction
A few years ago, I used to store local logs from syslog to ElasticSearch 7.x. The logs will be saved to local server (/var/log/messages) and also send to remote network location by rsyslog. The log aggregator is Fluentd (Ruby based). I did not used the official Fluentd distribution. Instead, I used the one distributed by Treasure Data Inc (aka td-agent). Since I am using Fedora and td-agent only supports RHEL/CentOS/SUSE Linux distribution. Sometimes I got problems after my Fedora had performed system upgrade.
This setting works until August of 2024. Suddenly the Fluentd consumed lots of CPU when I run some large applications in the same server. So, I migrated the indexes from ElasticSearch 7.x to OpenSearch 2.x. Next, I switch the logging aggregator from Fluentd to Vector (Rust based). Everything is back to normal.
Migrate to a new setup (OTel with ClickHouse)
Recently, I was looking at OpenTelemetry (OTel). OTel is a CNCF project. It is a framework that consists of APIs and SDKs for instrument, collect and storing telemetry data. It is vendor neutral and the components are inter-changeable with other vendors. It is becoming the industry standard for observability in distributed systems and cloud-native systems. I would like to use OTel collector as the bridge between the source of the logs (rsyslog) and the output processed by OTel.
According to an article that talked about OEC stack (oTEL, eBPF, ClickHouse), there are several open source products utilizing OTel and ClickHouse OLAP database. Then I tried some open source APM like Uptrace and SigNoz.
Uptrace seems to have their own ClickHouse schema for storing telemetry data. SigNoz’s schema is quite similar to the reference ClickHouse schema from the OTel collector (contrib build).
For the data storage, I would choose ClickHouse, mainly because of the storage efficiency. OpenSearch or ElasticSearch are consuming a large amount of disk space.
Migration Part 1 - ClickHouse installation
There are several choices for installation of ClickHouse: RPM package, Podman/Docker, using Helm chart provided by Bitnami or using the operator from Altinity. By the way, Bitnami recently announced they would commercialize their Bitnami application catalog.
For my usage (small scale), I installed ClickHouse using plain Kubernetes Statefulsets. One statefulset for the ClickHouse Keeper and another statefulset for the ClickHouse database.
One thing to note is that, by default, (all) system tables for the diagnostics purpose do not have any TTL configured. One may want to configure the TTL on those tables so that they would be housekeeped periodically.
Migration Part 2 - Create the schema for the logs
-
The first step is to create the database, create the users and grant privileges.
-
log_admin is the admin user of this database.
-
log_writer is the user that can write to the database.
-
log_reader is the user that only has read privilege to the database.
        -- Create database and users
CREATE DATABASE IF NOT EXISTS log_storage;

CREATE USER IF NOT EXISTS log_admin:
  IDENTIFIED WITH sha256_password BY 'log_admin_password';

GRANT CREATE TABLE, DROP TABLE, TRUNCATE TABLE, SELECT, INSERT, UPDATE, DELETE ON log_storage.* TO log_admin;
GRANT CLUSTER ON *.* TO log_admin;

CREATE USER IF NOT EXISTS log_writer
  IDENTIFIED WITH sha256_password BY 'log_writer_password';
GRANT INSERT, UPDATE, SELECT, DELETE ON log_storage.* TO log_writer;

CREATE USER IF NOT EXISTS log_reader
  IDENTIFIED WITH sha256_password BY 'log_reader_password';
GRANT SELECT ON log_storage.* TO log_reader;
-
-
Next, I would like to create the schema. We will extend the reference schema from OTel collector (contrib) ClickHouse exporter. I also I referenced below items:
-
Edit: this article originally written for/during otel log schema v1 (2024)
-
For otel log schema v2 (mid-2025), there are some changes. The schema is not used in this article. But I put the related URL in below
Instead of creating a schema and store data directly, I created a schema (log_null) using the Null engine. The schema log_data extends the log_null schema. Next, I created a materialized view (log_data_mv) that referenced the log_data and log_null schema. This is to decouple data ingestion from data processing. Changes in ingestion or processing can be made independently without affecting the other. Besides that, we can have data manipulation or filtering when data is sent to the materialized view.
        -- Edit: otel log schema v1
CREATE TABLE IF NOT EXISTS log_storage.log_null
(
  `Timestamp` DateTime64(9),
  `ObservedTimestamp` DateTime64(9),
  `TraceId` String,
  `SpanId` String,
  `TraceFlags` UInt32,
  `SeverityText` String,
  `SeverityNumber` Int32,
  `ServiceName` String,
  `Body` String,
  `ResourceSchemaUrl` String,
  `ResourceAttributes` Map(LowCardinality(String), String),
  `ScopeSchemaUrl` String,
  `ScopeName` String,
  `ScopeVersion` String,
  `ScopeAttributes` Map(LowCardinality(String), String),
  `LogAttributes` Map(LowCardinality(String), String),
  `Namespace` String,
  `ContainerName` String,
  `PodName` String,
  `ProcessId` Int32,
  `SourceType` String,
  `SourceHostname` String
) ENGINE = Null;
CREATE TABLE IF NOT EXISTS log_storage.log_data ON CLUSTER `default`
(
`Timestamp` DateTime64(9) CODEC(DoubleDelta, LZ4),
`ObservedTimestamp` DateTime64(9) DEFAULT `Timestamp` CODEC(DoubleDelta, LZ4),
`TraceId` String CODEC(ZSTD(1)),
`SpanId` String CODEC(ZSTD(1)),
`TraceFlags` UInt32 CODEC(ZSTD(1)),
`SeverityText` LowCardinality(String) CODEC(ZSTD(1)),
`SeverityNumber` Int32 CODEC(ZSTD(1)),
`ServiceName` LowCardinality(String) CODEC(ZSTD(1)),
`Body` String CODEC(LZ4),
`ResourceSchemaUrl` String CODEC(ZSTD(1)),
`ResourceAttributes` Map(LowCardinality(String), String) CODEC(ZSTD(1)),
`ScopeSchemaUrl` String CODEC(ZSTD(1)),
`ScopeName` String CODEC(ZSTD(1)),
`ScopeVersion` String CODEC(ZSTD(1)),
`ScopeAttributes` Map(LowCardinality(String), String) CODEC(ZSTD(1)),
`LogAttributes` Map(LowCardinality(String), String) CODEC(ZSTD(1)),
`Namespace` LowCardinality(String) CODEC(ZSTD(1)),
`ContainerName` String CODEC(ZSTD(1)),
`PodName` String CODEC(ZSTD(1)),
`ProcessId` Int32 CODEC(ZSTD(1)),
`SourceType` LowCardinality(String) CODEC(ZSTD(1)),
`SourceHostname` String CODEC (ZSTD(1)),
INDEX idx_body_idx lowerUTF8(Body) TYPE ngrambf_v1(4, 49152, 4, 0) GRANULARITY 1,
INDEX idx_trace_id TraceId TYPE bloom_filter(0.001) GRANULARITY 4,
INDEX idx_namespace Namespace TYPE bloom_filter(0.001) GRANULARITY 4,
INDEX idx_container_name ContainerName TYPE bloom_filter(0.01) GRANULARITY 4,
INDEX idx_pod_name PodName TYPE bloom_filter(0.01) GRANULARITY 4,
INDEX idx_severity_text SeverityText TYPE set(25) GRANULARITY 4,
INDEX idx_severity_number SeverityNumber TYPE set(25) GRANULARITY 4,
INDEX idx_res_attr_key mapKeys(ResourceAttributes) TYPE bloom_filter(0.01) GRANULARITY 1,
INDEX idx_res_attr_value mapValues(ResourceAttributes) TYPE bloom_filter(0.01) GRANULARITY 1,
INDEX idx_log_attr_key mapKeys(LogAttributes) TYPE bloom_filter(0.01) GRANULARITY 1,
INDEX idx_log_attr_value mapValues(LogAttributes) TYPE bloom_filter(0.01) GRANULARITY 1,
INDEX idx_timestamp Timestamp TYPE minmax GRANULARITY 4,
INDEX idx_observed_timestamp ObservedTimestamp TYPE minmax GRANULARITY 4,
) ENGINE = ReplicatedMergeTree
PARTITION BY toDate(Timestamp)
ORDER BY (Timestamp, SeverityText)
SETTINGS index_granularity = 8192, ttl_only_drop_parts = 1; CREATE MATERIALIZED VIEW
log_storage.log_data_mv TO log_storage.log_data AS
SELECT
`Timestamp`,
`ObservedTimestamp`,
`TraceId`,
`SpanId`,
`TraceFlags`,
`SeverityText`,
`SeverityNumber`,
`ServiceName`,
`Body`,
`ResourceSchemaUrl`,
`ResourceAttributes`,
`ScopeSchemaUrl`,
`ScopeName`,
`ScopeVersion`,
`ScopeAttributes`,
`LogAttributes`,
`Namespace`,
`ContainerName`,
`PodName`,
`ProcessId`,
`SourceType`,
`SourceHostname`
FROM log_storage.log_null; Migration Part 3 - Export data in OpenSearch to JSON format
I had some old indexes stored in OpenSearch. I would export all of them to files in JSON format. I tried the elasticdump module from nodeJS and the opensearchpy module from Python. Using the Python module is faster when I do the testing. To save space, the plain text files (in JSON format) will be further compressed by gzip.
Migration Part 4 - Migrate data previously generated by Fluentd and Vector
For the JSON files, the older data are generated by Fluentd. More recent ones are generated by Vector.
For both cases, I would be using Vector to read the JSON files. Vector can read the gzipped files directly. Then, it will go through transformation and then send to ClickHouse. Below code snippet is part of the configuration file using Vector for the conversion. It is suitable for data created by Fluentd. I need two configuration files, one for the data created by Fluentd, another one for the data created by Vector.
        sources:
  json_file:
    type: file
    include:
      - ./output/restored_logstash-2023.12.json.gz
    data_dir: /tmp
    read_from: beginning
    fingerprinting:
      strategy: checksum

transforms:
  remap_fields:
    type: "remap"
    inputs:
      - json_file
    source: |

      parsed_message = parse_json!(.message)

      if parsed_message == null {
        abort
      }

      .Timestamp = parsed_message._source.@timestamp
      del(.@timestamp)

      date_value = get!(parsed_message._source.t, ["$$date"])
      if date_value != null {
        parsed_observed_ts = parse_timestamp!(date_value, "%+")
        .ObservedTimestamp = format_timestamp!(parsed_observed_ts, "%Y-%m-%dT%H:%M:%S.%3f")
      } else {
        .ObservedTimestamp = .Timestamp
      }

      # .... include other fields for conversion
      if exists(parsed_message._source.ident) {
        .LogAttributes.appname = parsed_message._source.ident
      } else if !exists(parsed_message._source.attr){
        .Body = parsed_message._source
      }
      # .... include other fields for conversion

      # Remove unnecessary fields
      del(.message)
      del(.file)
      del(.host)
      del(.timestamp)
      del(.source_type)

sinks:
  ch:
    type: clickhouse
    inputs:
      - remap_fields
    endpoint: "http://clickhouse-server.ch-main.svc.cluster.local:8123"
    compression: "lz4"
    auth:
      strategy: basic
      user: "log_writer"
      password: "log_writer_password"
    database: log_storage
    table: log_null
    skip_unknown_fields: true
    date_time_best_effort: true
    encoding:
      timestamp_format: rfc3339
    healthcheck: false
The ingestion took a few minutes for about 2.5 GB of data (about 150MB compressed). We can used below command to check the total number of records in the JSON file and in the database.
        $ unpigz -c restored_logstash-2024.05.json.gz | wc -l
7617273
SELECT count(*)
FROM log_storage.log_data
WHERE (Timestamp >= '2024-05-01 00:00:00') AND (Timestamp <= '2024-05-31 23:59:59')
Query id: e832c3b7-ba61-4c81-a34a-3653cf9dab4a
┌─count()─┐
1. │ 7617273 │ -- 7.62 million
└─────────┘ Sending log from rsyslog to ClickHouse
With the setting in place, I stopped sending send logs from rsyslog to OpenSearch. Instead, I will send the logs to ClickHouse.
In this case, I used the OTel collector to receive remote syslog data. After it is processed, it is sent to the database using the ClickHouse exporter.
Below is the configuration of the rsyslog and the OTel collector (contrib).
        # With this setting, it can be injected into vector.dev
# OTel
*.* @@127.0.0.1:15140;RSYSLOG_SyslogProtocol23Format receivers:
syslog:
tcp:
listen_address: "0.0.0.0:15140"
protocol: rfc5424
processors:
batch:
timeout: 22s
send_batch_size: 8192
attributes:
actions:
- action: delete
key: message
exporters:
clickhouse:
endpoint: tcp://clickhouse-server.ch-main.svc.cluster.local:9000?dial_timeout=15s
username: log_writer
password: log_writer_password
database: log_storage
async_insert: true
compress: lz4
create_schema: false
logs_table_name: log_data
timeout: 15s
retry_on_failure:
enabled: true
initial_interval: 10s
max_interval: 30s
max_elapsed_time: 300s
cluster_name: default
table_engine:
name: ReplicatedMergeTree
service:
pipelines:
logs:
receivers: [syslog]
processors: [attributes, batch]
exporters: [clickhouse] With the above configuration, the syslog messages would be sent to 127.0.0.1:15140. That network location is served by the OTel collector (syslog receiver). The collector would send data to ClickHouse in batches.
How much storage space does it save?
Below is the SQL statement that query the ClickHouse system table for the uncompressed data size and the compressed data size. Then calculate the compression rate.
        SELECT
    sum(rows) AS total_rows,
    formatReadableSize(sum(data_uncompressed_bytes)) AS uncompressed_bytes,
    formatReadableSize(sum(data_compressed_bytes)) AS compressed_bytes,
    round((sum(data_uncompressed_bytes) / sum(data_compressed_bytes)), 2) AS compression_rate,
    `table` AS table_name
FROM system.parts
WHERE database = 'log_storage'
GROUP BY table_name
ORDER BY compressed_bytes ASC

Query id: 96eb7c2b-74ba-48b3-b09c-6f1ece17db19

   ┌─total_rows─┬─uncompressed_bytes─┬─compressed_bytes─┬─compression_rate─┬─table_name─┐
1. │  407494808 │ 100.53 GiB         │ 9.10 GiB         │            11.05 │ log_data   │
   └────────────┴────────────────────┴──────────────────┴──────────────────┴────────────┘
Below table illustrated the uncompressed raw data size and the compressed data size of different storage methods.
Type of storage method | Uncompressed storage size | Compressed storage size | Compression ratio |
Physical files as JSON | 160.82 GB | 7.2 GB | 22.34 |
OpenSearch index | 160.82 GB(estimated) | 124.25 GB | 1.29 |
Space used, reported inside ClickHouse (including indexes) | 100.53 GB | 9.10 GB | 11.05 |
Physical space used by ClickHouse, file system level | 160.82 GB(estimated) | 17 GB | 9.46 |
The above table shows that raw compressed text files have the highest compression ratio. But we seldom use this method because there are no external searching system/methods attached to it.
OpenSearch’s compression ratio is low. It may be due to the indexing characteristics of OpenSearch (use of inverted index), which is fast for searching but is storage intensive.
In my use case, ClickHouse has the best compression ratio. But we need to design/create the schema in the database before we can use it.
Visualization and Searching
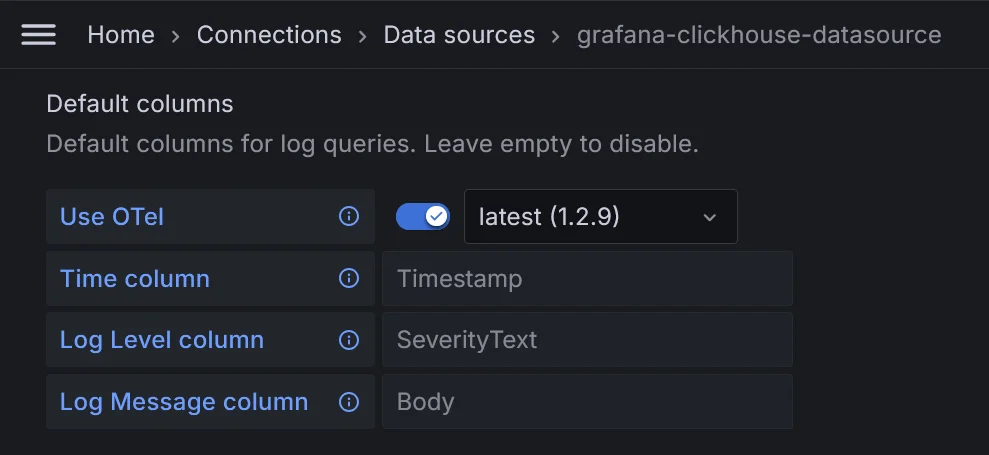
For visualization or log searching, I would like to use Grafana after looking at this article about using the ClickHouse plugin in Grafana.
After installing the plugin, I created the ClickHouse data source. For the columns in the log configuration, we can select the OTel option and the columns to use would be automatically selected.
-
Searching the logs with Grafana
Suppose we have below logs in the syslog (/var/log/messages). (The hostname is redacted to 'servername')
Dec 21 01:11:17 servername k3s[14457]: E1221 01:11:17.378396 14457 cpu_manager.go:395] "RemoveStaleState: removing container" podUID="56ec910a-b8a3-43af-90bd-6ff3f8caad20" containerName="opensearch"
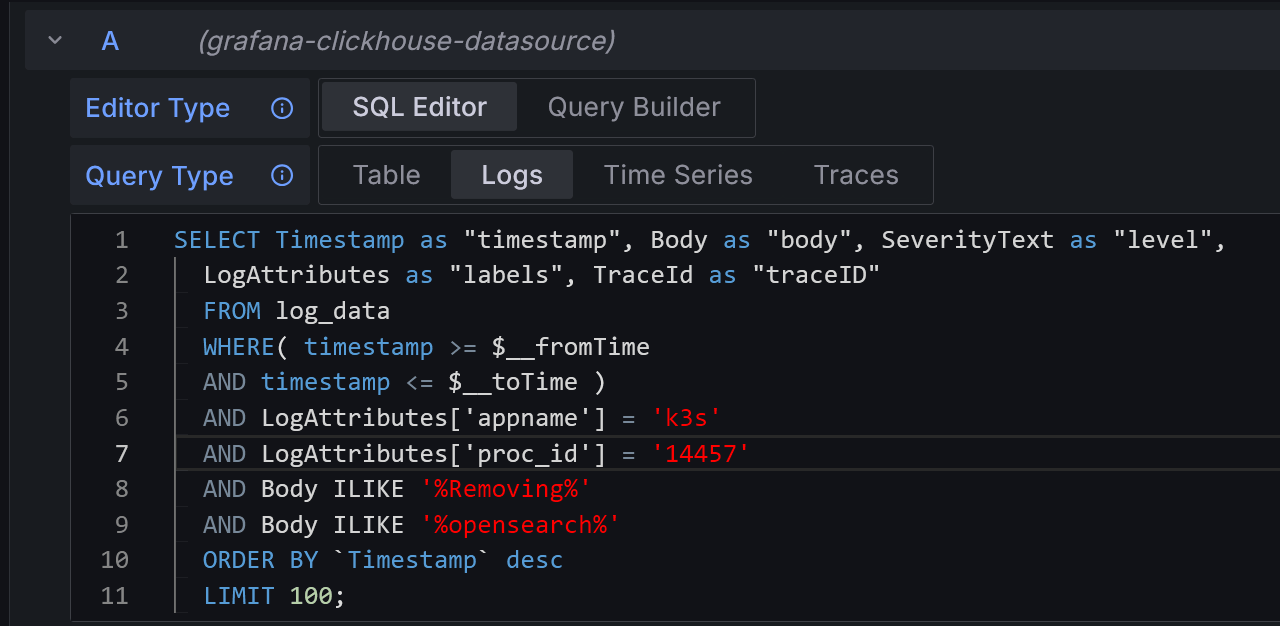
Dec 21 01:11:17 servername k3s[14457]: I1221 01:11:17.378645 14457 memory_manager.go:354] "RemoveStaleState removing state" podUID="56ec910a-b8a3-43af-90bd-6ff3f8caad20" containerName="opensearch" Then we can use below SQL statement in Grafana to search the log. Note we will select the range of dates in Grafana, it will be referred by the SQL statement. We are searching the logs with below criteria:
-
Log attributes with appname equals 'k3s'
-
Log attributes with process ID equals 14457
-
Message contents (Body) including the text 'Removing' (case insensitive)
-
Message contents (Body) including the text 'opensearch' (case insensitive)
-
Order the column 'Timestamp' in descending order
-
Only display 100 rows
SELECT Timestamp as "timestamp", Body as "body", SeverityText as "level",
LogAttributes as "labels", TraceId as "traceID"
FROM log_data
WHERE( timestamp >= $__fromTime AND timestamp <= $__toTime )
AND LogAttributes['appname'] = 'k3s'
AND LogAttributes['proc_id'] = '14457'
AND Body ILIKE '%Removing%'
AND Body ILIKE '%opensearch%'
ORDER BY `Timestamp` DESC
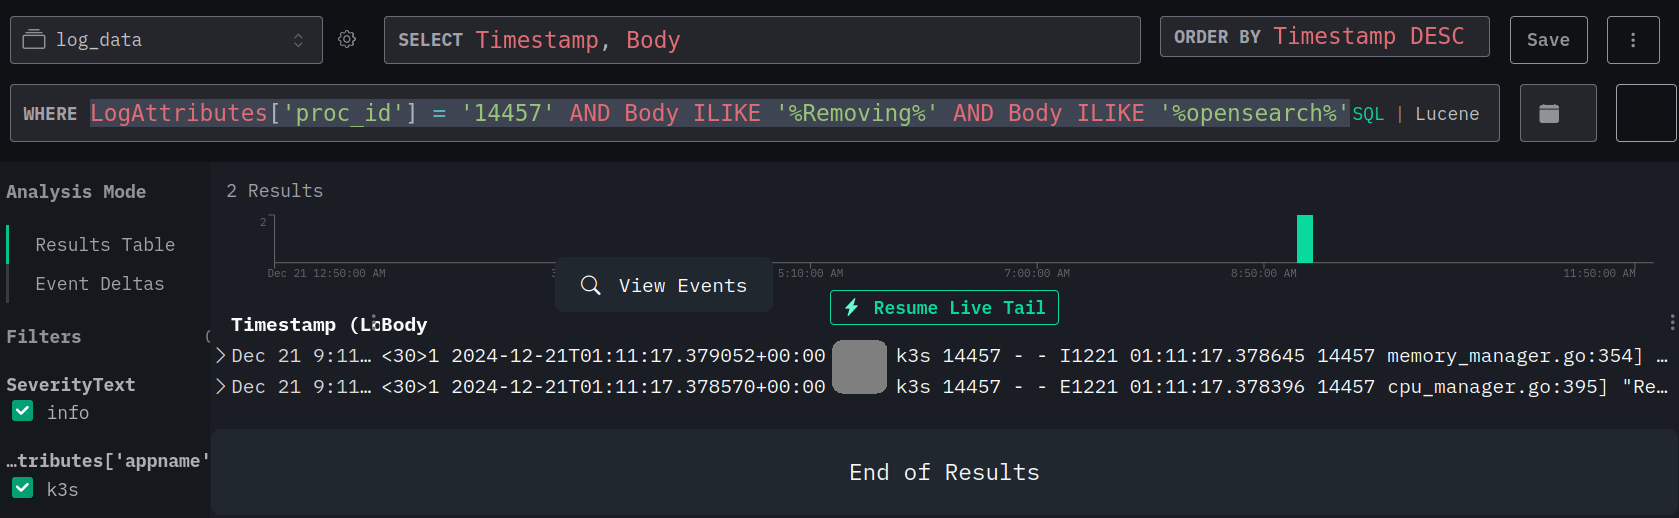
LIMIT 100; Below image shows how we search the log. Redaction is done to the hostname.
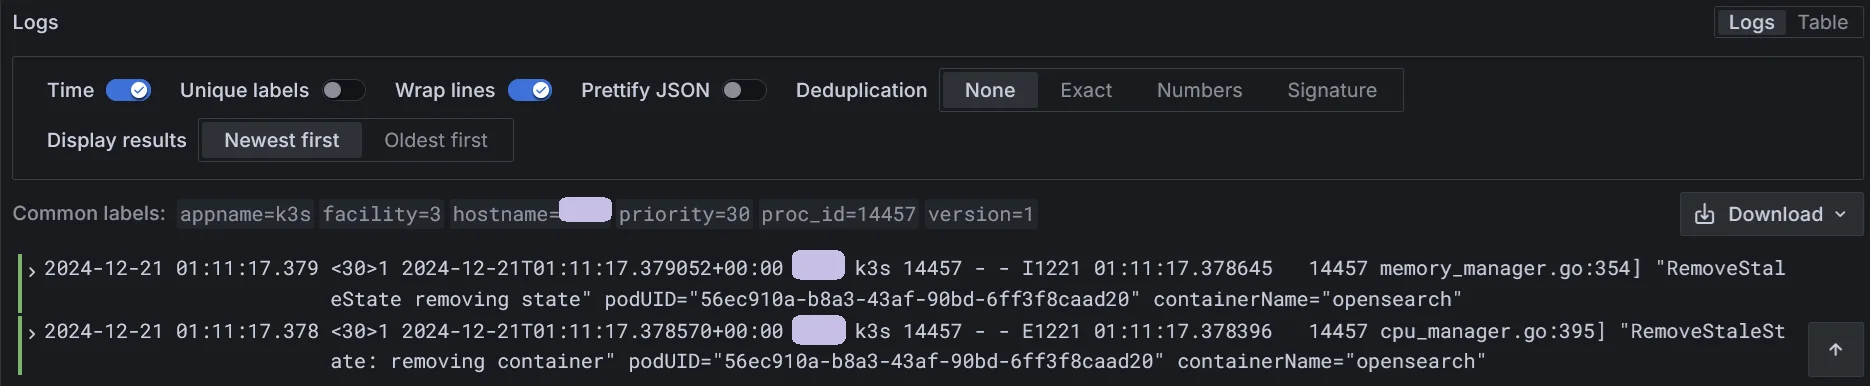
Below image shows how Grafana display the result. Hostname is redacted. To me, the overall searching speed is fast.
-
Edit: the SQL in the original article (2024) is an unoptimized one. Below is an optimzed query (to match how we use the index with the 'Body')
        SELECT Timestamp as "timestamp", Body as "body", SeverityText as "level",
  LogAttributes as "labels", TraceId as "traceID"
  FROM log_data
  WHERE( timestamp >= $__fromTime AND timestamp <= $__toTime )
  AND LogAttributes['appname'] = 'k3s'
  AND LogAttributes['proc_id'] = '14457'
  AND lowerUTF8(Body) ILIKE '%Removing%'
  AND lowerUTF8(Body) ILIKE '%opensearch%'
  ORDER BY `Timestamp` DESC
  LIMIT 100;
HyperDX can be used an UI interface to an existing ClickHouse database. But I had problem with the non-Cloud setup. So, I have to run it on local mode (on localhost). Here’s a screenshot when performing the same searching we had mentioned before: One restriction found in current version of HyperDX 2.0 is that the selectable date range inside the UI (2.0 currently in beta) is only maximum of previous one year away from the current date.